Beyond Complete-Data Accuracy: Robustness and Calibration of Diabetes Status Classification Under Feature Unavailability
DOI:
https://doi.org/10.56705/0svby421Keywords:
Diabetes Status Classification, Feature Unavailability, Missingness-Aware Learning, Model Robustness, Probability Calibration, BRFSSAbstract
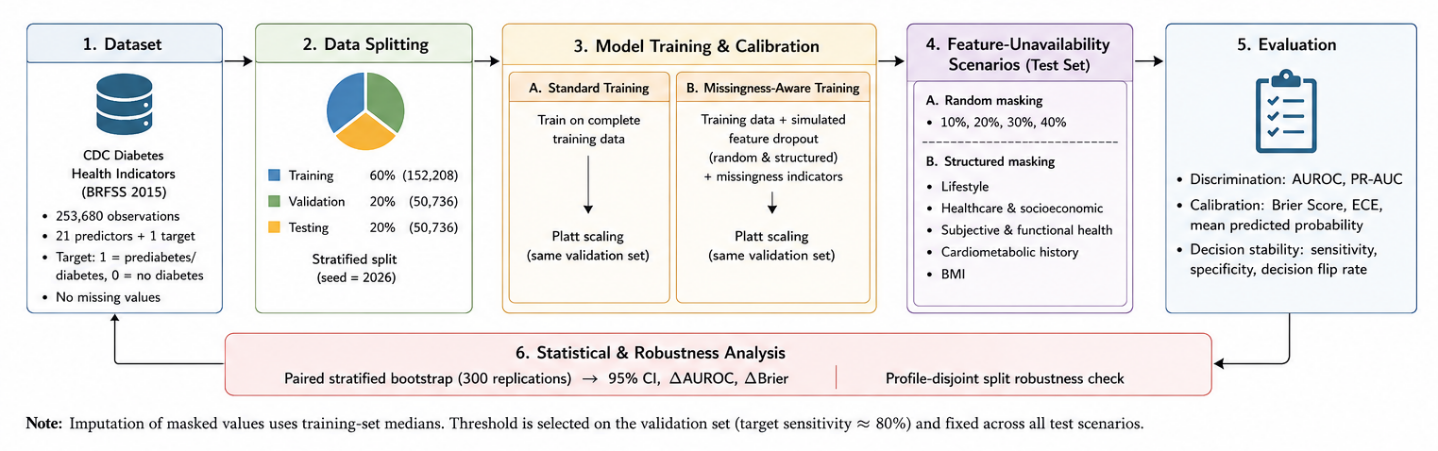
Introduction: Machine learning models developed under complete-data conditions may become unreliable when some predictors are unavailable during deployment. This study evaluates the robustness of survey-based prediabetes/diabetes status classification under random and structured feature unavailability. Method: The CDC Diabetes Health Indicators dataset containing 253,680 observations and 21 predictors was used. Logistic Regression and HistGradientBoosting were evaluated using standard complete-data training and missingness-aware training with simulated feature dropout and missingness indicators. Performance was assessed using AUROC, PR-AUC, Brier Score, Expected Calibration Error, sensitivity, specificity, and decision stability under complete-data, random feature-loss, and structured feature-loss scenarios. Results: Under complete data, standard and missingness-aware HistGradientBoosting achieved similar AUROC values of 0.8298 and 0.8297. At 40% random feature unavailability, the standard model declined to an AUROC of 0.7729 and ECE of 0.0561, while the missingness-aware model maintained an AUROC of 0.7938 and ECE of 0.0064. Sensitivity decreased from 0.8031 to 0.4689 for the standard model, whereas the missingness-aware model retained 0.7498. Cardiometabolic and functional-health feature loss produced greater degradation than lifestyle feature loss. Conclusion: Complete-data performance may overestimate model reliability under incomplete information. Missingness-aware training improved discrimination, calibration, and decision stability without materially reducing performance when all predictors were available.
References
[1] C. M. Pickens, C. Pierannunzi, W. Garvin, and M. Town, “Surveillance for certain health behaviors and conditions among states and selected local areas—Behavioral Risk Factor Surveillance System, United States, 2015,” MMWR Surveillance Summaries, vol. 67, no. 9, pp. 1–90, 2018, doi: https://doi.org/10.15585/mmwr.ss6709a1.
[2] Centers for Disease Control and Prevention, “CDC Diabetes Health Indicators,” UCI Machine Learning Repository, 2017, doi: https://doi.org/10.24432/C53919.
[3] Z. Xie, O. Nikolayeva, J. Luo, and D. Li, “Building risk prediction models for type 2 diabetes using machine learning techniques,” Preventing Chronic Disease, vol. 16, Art. no. E130, 2019, doi: https://doi.org/10.5888/pcd16.190109.
[4] Z. Ullah, F. Saleem, M. Jamjoom, B. Fakieh, F. Kateb, A. M. Ali, and B. Shah, “Detecting high-risk factors and early diagnosis of diabetes using machine learning methods,” Computational Intelligence and Neuroscience, vol. 2022, Art. no. 2557795, 2022, doi: https://doi.org/10.1155/2022/2557795.
[5] M. M. Chowdhury, R. S. Ayon, and M. S. Hossain, “An investigation of machine learning algorithms and data augmentation techniques for diabetes diagnosis using class imbalanced BRFSS dataset,” Healthcare Analytics, vol. 5, Art. no. 100297, 2024, doi: https://doi.org/10.1016/j.health.2023.100297.
[6] V. P. Nugraha and A. Febrian, “Comprehensive diabetes risk prediction using BRFSS data: Performance, explainability, fairness, and calibration,” Journal of Applied Informatics and Computing, vol. 10, no. 3, pp. 2357–2368, 2026, doi: https://doi.org/10.30871/jaic.v10i3.12740.
[7] H. Azis, M. Abdullah, and S. Ismail, “Performance comparison of various weight and combination function on heterogeneous parallel ensemble machine learning model,” Journal of Advanced Research in Applied Sciences and Engineering Technology, vol. 56, no. 4, pp. 342–353, 2025, doi: https://doi.org/10.37934/araset.56.4.342353.
[8] A. Latip, H. Azis, H. Himawan, and D. A. Kurnia, “SMOTE technique utilization in cirrhosis classification: A comparison of Gradient Boosting and XGBoost,” International Journal of Informatics and Computing, vol. 1, no. 1, pp. 34–40, 2025.
[9] Purnawansyah, A. P. Wibawa, T. Widiyaningtyas, Haviluddin, H. Darwis, and H. Azis, “An in-depth exploration of supervised and semi-supervised learning on face recognition,” Open Computer Science, vol. 15, no. 1, pp. 817–840, 2025, doi: https://doi.org/10.1515/comp-2025-0029.
[10] H. Azis, A. Alisma, Purnawansyah, and N. Nirmala, “Analisis kinerja algoritma pembelajaran mesin ensemble pada dataset multi kelas citra JAFFE,” NERO (Networking Engineering Research Operation), vol. 9, no. 2, pp. 107–118, 2024, doi: https://doi.org/10.21107/nero.v9i2.27872.
[11] H. Darwis, Z. Ali, Purnawansyah, H. Lahuddin, and H. Azis, “Deep dive into PubMed RCT: Leveraging tribrid embedding recurrent neural network model,” ICIC Express Letters, vol. 19, no. 1, pp. 111–118, 2025, doi: https://doi.org/10.24507/icicel.19.01.111.
[12] R. Mitra et al., “Learning from data with structured missingness,” Nature Machine Intelligence, vol. 5, no. 1, pp. 13–23, 2023, doi: https://doi.org/10.1038/s42256-022-00596-z.
[13] T. Shadbahr et al., “The impact of imputation quality on machine learning classifiers for datasets with missing values,” Communications Medicine, vol. 3, Art. no. 139, 2023, doi: https://doi.org/10.1038/s43856-023-00356-z.
[14] Y. E. Shin, M. H. Gail, and R. M. Pfeiffer, “Assessing risk model calibration with missing covariates,” Biostatistics, vol. 23, no. 3, pp. 875–890, 2022, doi: https://doi.org/10.1093/biostatistics/kxaa060.
[15] K. Luijken, R. H. H. Groenwold, B. Van Calster, E. W. Steyerberg, and M. van Smeden, “Impact of predictor measurement heterogeneity across settings on the performance of prediction models: A measurement error perspective,” Statistics in Medicine, vol. 38, no. 18, pp. 3444–3459, 2019, doi: https://doi.org/10.1002/sim.8183.
[16] B. Van Calster, D. J. McLernon, M. van Smeden, L. Wynants, and E. W. Steyerberg, “Calibration: The Achilles heel of predictive analytics,” BMC Medicine, vol. 17, Art. no. 230, 2019, doi: https://doi.org/10.1186/s12916-019-1466-7.
[17] J. H. Friedman, “Greedy function approximation: A gradient boosting machine,” The Annals of Statistics, vol. 29, no. 5, pp. 1189–1232, 2001, doi: https://doi.org/10.1214/aos/1013203451.
[18] J. C. Platt, “Probabilistic outputs for support vector machines and comparisons to regularized likelihood methods,” in Advances in Large Margin Classifiers, A. J. Smola, P. L. Bartlett, B. Schölkopf, and D. Schuurmans, Eds. Cambridge, MA, USA: MIT Press, 2000, pp. 61–74.
[19] T. Fawcett, “An introduction to ROC analysis,” Pattern Recognition Letters, vol. 27, no. 8, pp. 861–874, 2006, doi: https://doi.org/10.1016/j.patrec.2005.10.010.
[20] T. Saito and M. Rehmsmeier, “The precision-recall plot is more informative than the ROC plot when evaluating binary classifiers on imbalanced datasets,” PLoS ONE, vol. 10, no. 3, Art. no. e0118432, 2015, doi: https://doi.org/10.1371/journal.pone.0118432.
[21] G. W. Brier, “Verification of forecasts expressed in terms of probability,” Monthly Weather Review, vol. 78, no. 1, pp. 1–3, 1950, doi: https://doi.org/10.1175/1520-0493(1950)078<0001>2.0.CO;2.
[22] C. Guo, G. Pleiss, Y. Sun, and K. Q. Weinberger, “On calibration of modern neural networks,” in Proceedings of the 34th International Conference on Machine Learning, vol. 70, 2017, pp. 1321–1330.
[23] M. R. F. Rayhan, Harlinda, H. Darwis, and R. R. Raja, “Comparing ECLAT and Decision Tree for drug therapy recommendation rules on multi label clinical data,” Indonesian Journal of Data and Science, vol. 7, no. 2, pp. 168–182, 2026, doi: https://doi.org/10.56705/ijodas.v7i2.410.
[24] A. A. P. Agustavada, A. P. Wibawa, D. F. Hilmi, A. Sholum, and F. A. Dwiyanto, “Effect of spatial, intensity, and hybrid augmentation on kidney CT image classification,” Indonesian Journal of Data and Science, vol. 7, no. 2, pp. 300–317, 2026, doi: https://doi.org/10.56705/ijodas.v7i2.443.
[25] N. F. Azevedo Neto, O. P. Gomes, L. P. Piedade, F. S. Miranda, and R. S. Pessoa, “Interpreting reactive species interdependencies in plasma-activated saline: An exploratory multivariate workflow,” Indonesian Journal of Data and Science, vol. 7, no. 2, pp. 376–387, 2026, doi: https://doi.org/10.56705/ijodas.v7i2.417.
[26] U. Zaky, M. Habibi, A. Priadana, and T. E. Tarigan, “Gender-aware prediction of liver disease using machine learning and clinical laboratory data,” International Journal of Artificial Intelligence in Medical Issues, vol. 4, no. 1, pp. 110–130, 2026, doi: https://doi.org/10.56705/wtsdw234.
[27] A. P. Wibowo, M. L. Radhitya, E. Faizal, and I. Arfiani, “Machine learning-based clustering of viruses using taxonomic and genomic features for health informatics applications,” International Journal of Artificial Intelligence in Medical Issues, vol. 4, no. 1, pp. 72–92, 2026, doi: https://doi.org/10.56705/qstvhw47.
[28] B. Efron and R. J. Tibshirani, An Introduction to the Bootstrap. New York, NY, USA: Chapman & Hall, 1993.
[29] U. Held, A. Kessels, J. Garcia Aymerich, X. Basagaña, G. ter Riet, K. G. M. Moons, and M. A. Puhan, “Methods for handling missing variables in risk prediction models,” American Journal of Epidemiology, vol. 184, no. 7, pp. 545–551, 2016, doi: https://doi.org/10.1093/aje/kwv346.
[30] M. I. Gabr, Y. M. Helmy, and D. S. Elzanfaly, “Effect of missing data types and imputation methods on supervised classifiers: An evaluation study,” Big Data and Cognitive Computing, vol. 7, no. 1, Art. no. 55, 2023, doi: https://doi.org/10.3390/bdcc7010055.
[31] A. Aich et al., “A copula based supervised filter for feature selection in machine learning driven diabetes risk prediction,” Scientific Reports, vol. 16, Art. no. 12132, 2026, doi: https://doi.org/10.1038/s41598-026-41874-9.
[32] M. Talebi Moghaddam et al., “Predicting diabetes in adults: Identifying important features in unbalanced data over a 5-year cohort study using machine learning algorithm,” BMC Medical Research Methodology, vol. 24, Art. no. 220, 2024, doi: https://doi.org/10.1186/s12874-024-02341-z.
Downloads
Published
Issue
Section
License
Copyright (c) 2026 Nusantara Journal of Multidisciplinary Informatics
Creative Commons Attribution-NonCommercial 4.0 International (CC BY-NC 4.0)Copyright remains with the author(s), and articles are published under Creative Commons Attribution-NonCommercial 4.0 International (CC BY-NC 4.0).